Inflection Points
·
October 2026
7
1
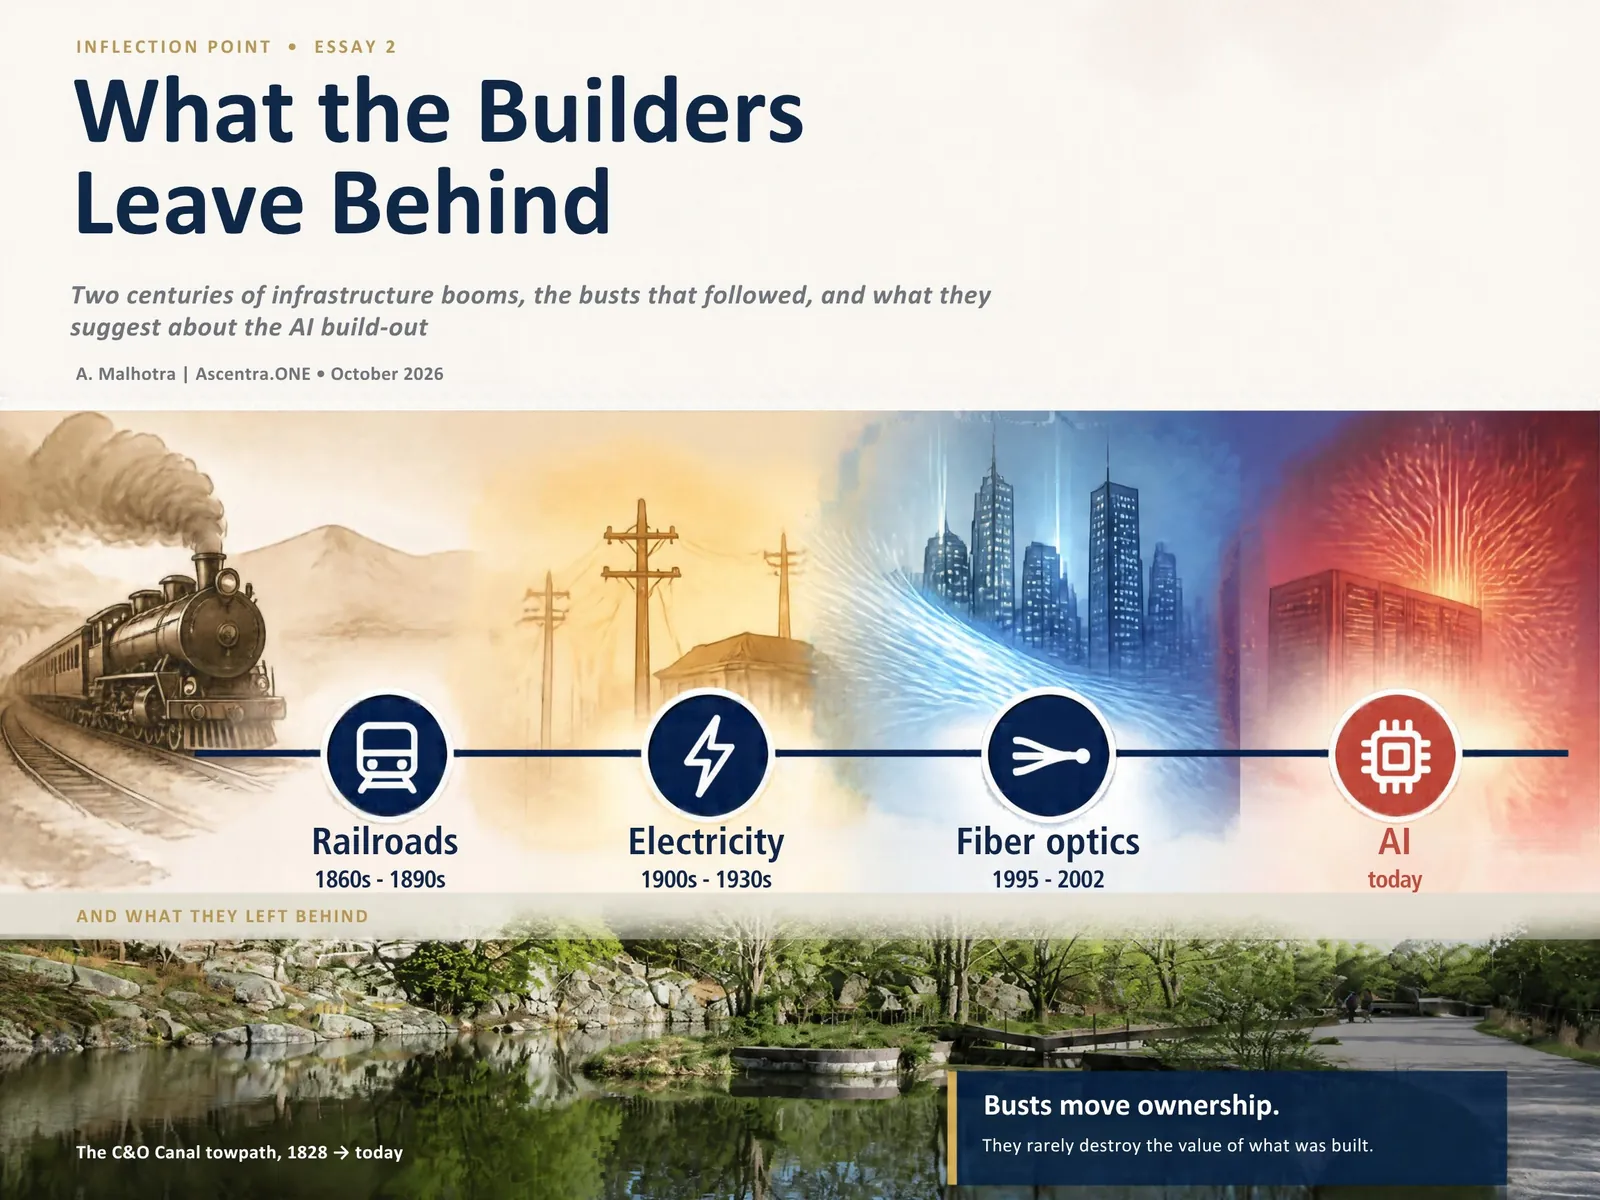
Busts move ownership. They rarely destroy the value of what was built.
The value arrives when organizations redesign themselves around the new floor, often decades after it is poured.
For AI, the better question than “is this a bubble?” is what outlasts a shakeout: power and sites endure, chips age fast, and intelligence keeps getting cheaper.
I live near the C&O Canal in Maryland, and regularly walk its towpath upriver toward the overlook at Great Falls. On most mornings it is quiet: runners, cyclists, a heron standing in the still water, the rush of the Potomac on the other side of the trees. It is easy to forget that this ditch was once one of the most ambitious engineering projects in the United States, and that it lost the race it was built to win.
In the 1820s, the young country's biggest economic problem was the Appalachian Mountains. Farms and coal fields were filling up west of the ridges, and whoever connected them to the coast would control the trade. New York had just done it: the Erie Canal, opened in 1825, linked the Hudson River to the Great Lakes and made New York City the commercial capital of the country almost overnight. Washington, Georgetown and Baltimore were determined not to be left behind. The Chesapeake and Ohio Canal was their answer: a waterway that would follow the Potomac from Georgetown, climb over the mountains, and reach the Ohio River at Pittsburgh.
On July 4, 1828, President John Quincy Adams turned the first spade of earth near Georgetown. The same day, about forty miles away, Baltimore's merchants laid the first stone of a rival project: the Baltimore and Ohio Railroad. Two technologies, aimed at the same destination, launched together.
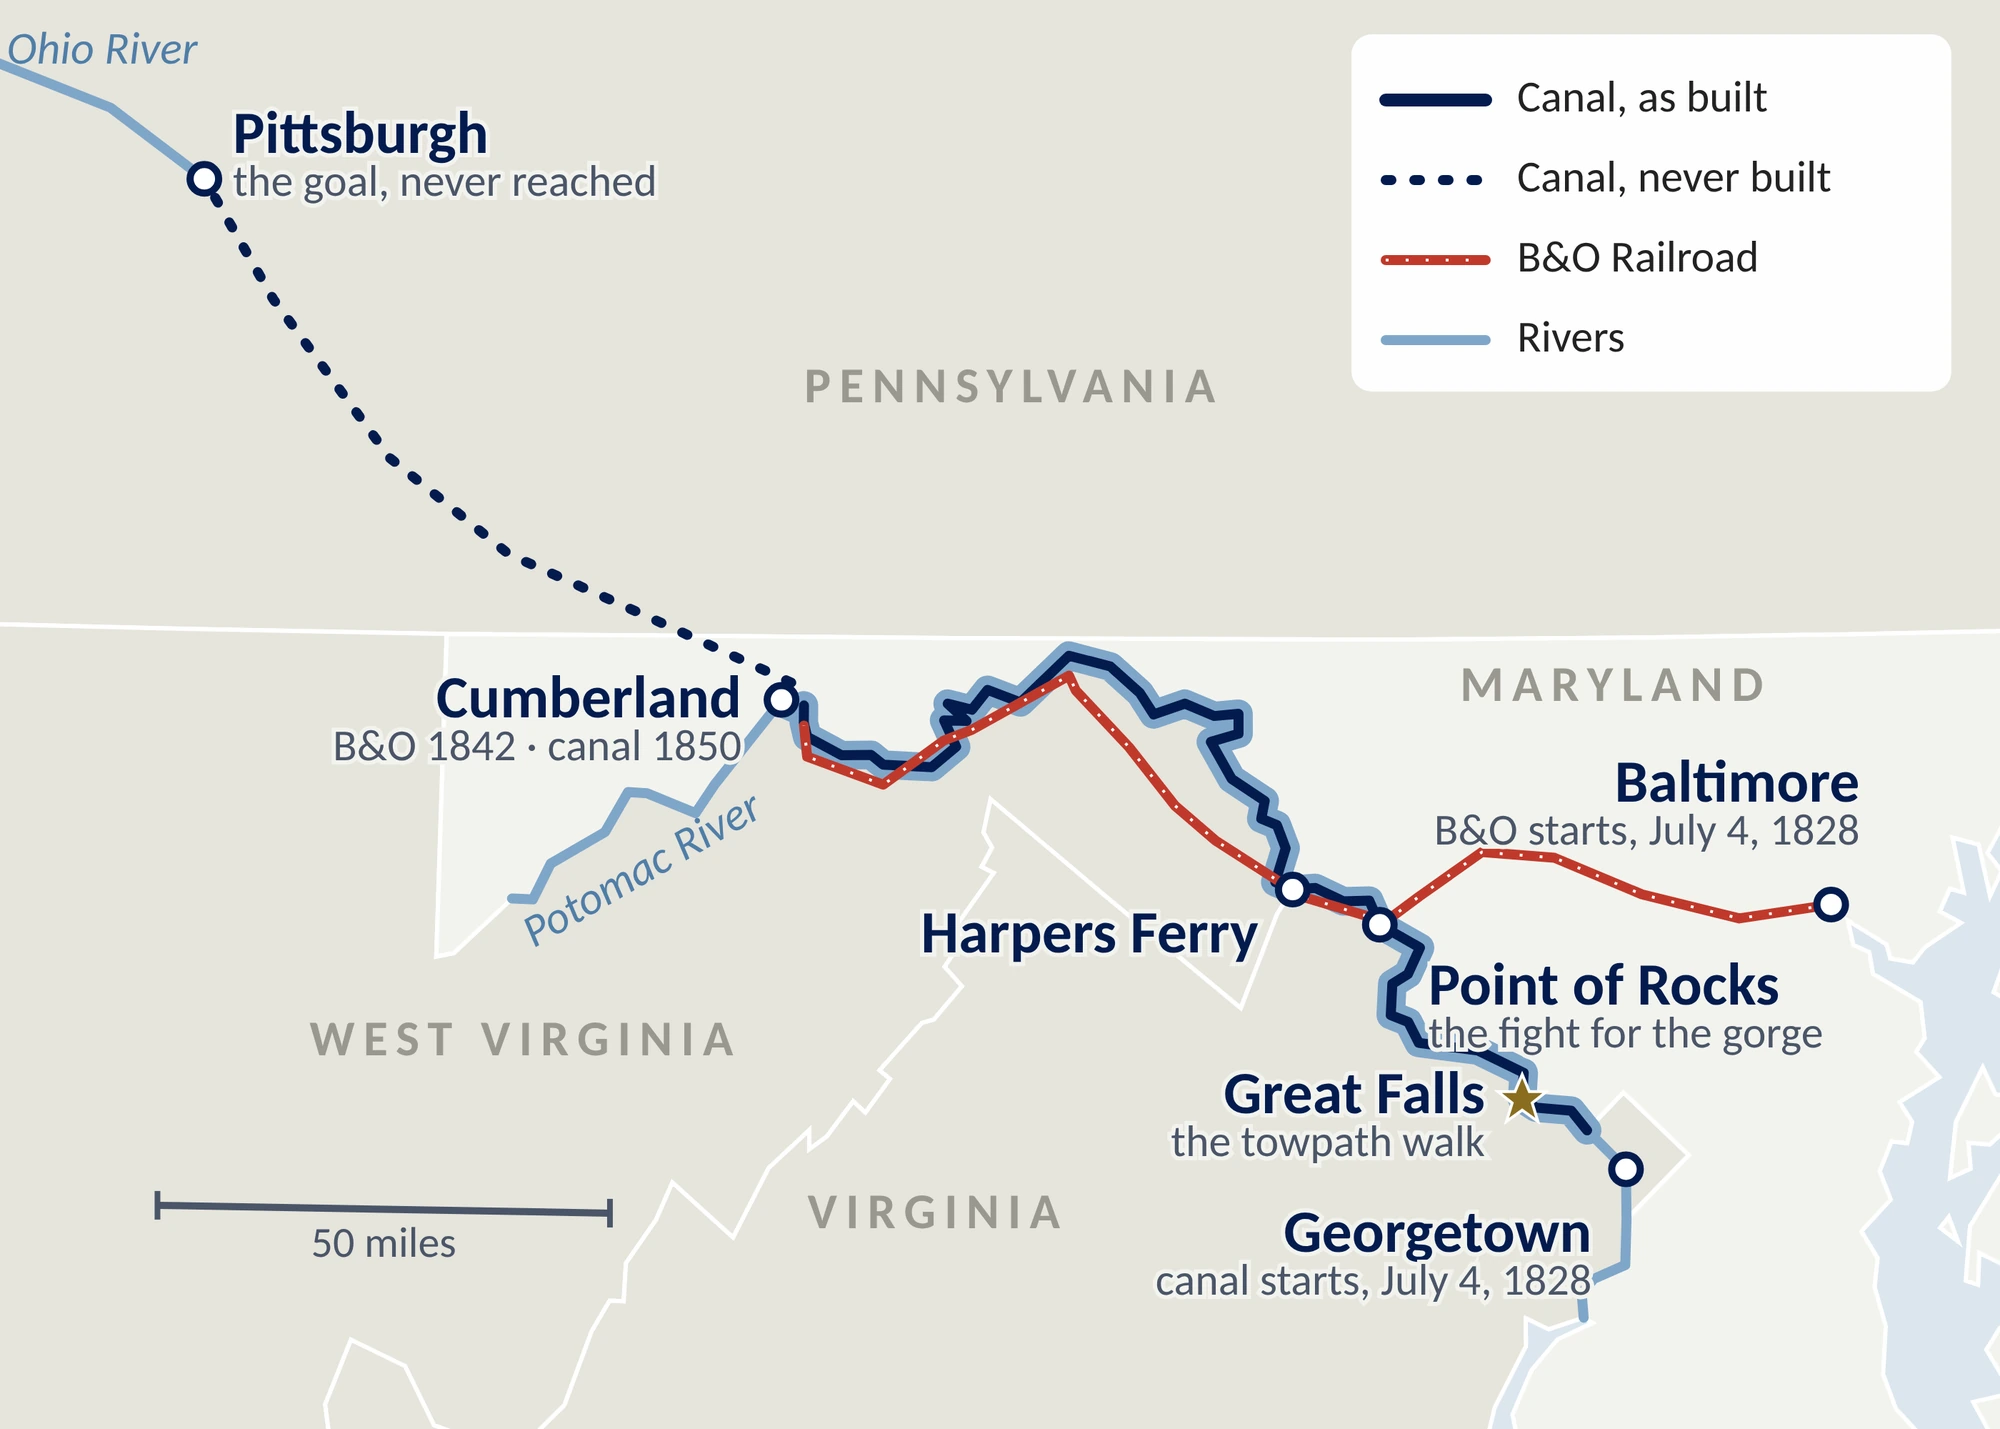
Figure 1. The C&O Canal followed the Potomac from Georgetown to Cumberland and never reached Pittsburgh; the B&O, begun the same day in Baltimore, reached Cumberland eight years sooner. Routes simplified; base map from U.S. Census Bureau boundaries.
Congress invested $1 million in the canal company. The engineers estimated about $4.5 million to reach Cumberland, Maryland; the final bill was about $11 million. The two projects fought in the courts over the narrow strip of land between the river and the cliffs at Point of Rocks and tied up both projects for four years. The railroad reached Cumberland in 1842. The canal arrived eight years later, in 1850, and never went any further. The plan to reach Pittsburgh was quietly dropped.
The railroad kept going. By late 1852, the B&O had reached the Ohio River at Wheeling: the destination the canal had been chartered to reach. In 1869, barely four decades after that double groundbreaking, railroads connected the Atlantic to the Pacific. The canal was still hauling coal down the Potomac at the pace of a mule.
The canal still did useful work. For decades its mule-drawn boats carried coal to Georgetown. But in 1889 a flood ruined it and bankrupted the company, and the canal ended up being run under court supervision for its bondholders, led by its old rival, the B&O. A second flood in 1924 ended commercial operations for good. In 1938 the federal government bought what was left.
By any measure its builders would have recognized, the C&O Canal was a failure. Hold that thought. I will come back to it.
In the first essay in this series, I drew a distinction between disruptions that move a layer of an industry and those that move the floor: the underlying premise of how value is created. This essay is about a related question that every floor-moving technology eventually raises. Somebody has to pour that new floor: lay the track, string the wires, bury the cable, build the data centers. Who pays for it? And who ends up standing on it?
History gives a surprisingly consistent answer. A new technology arrives with obvious promise. Capital floods in, often borrowed. Rivals build in parallel, and more gets built than near-term demand can pay for. A financial shock arrives, and many of the builders fail. Their assets are sold, frequently for a fraction of what they cost, to new owners. And then, over the following decades, the economy grows on top of what was built, often in ways the original builders never imagined.
Not every build-out follows this script. The interstate highways and most city water systems were planned and paid for by governments, so there was no race among rivals and no bust; their risk runs the other way, toward too little money for upkeep once the ribbon is cut. The airlines went bankrupt again and again after deregulation, but the airports and air traffic control they depended on were public. The pattern belongs to build-outs where private capital races for the same prize, and in the United States, that is how AI is being built.
Busts move ownership. They rarely destroy the value of what was built.
The people who pour the floor and the people who prosper on it are often not the same people. Three booms show the pattern clearly.
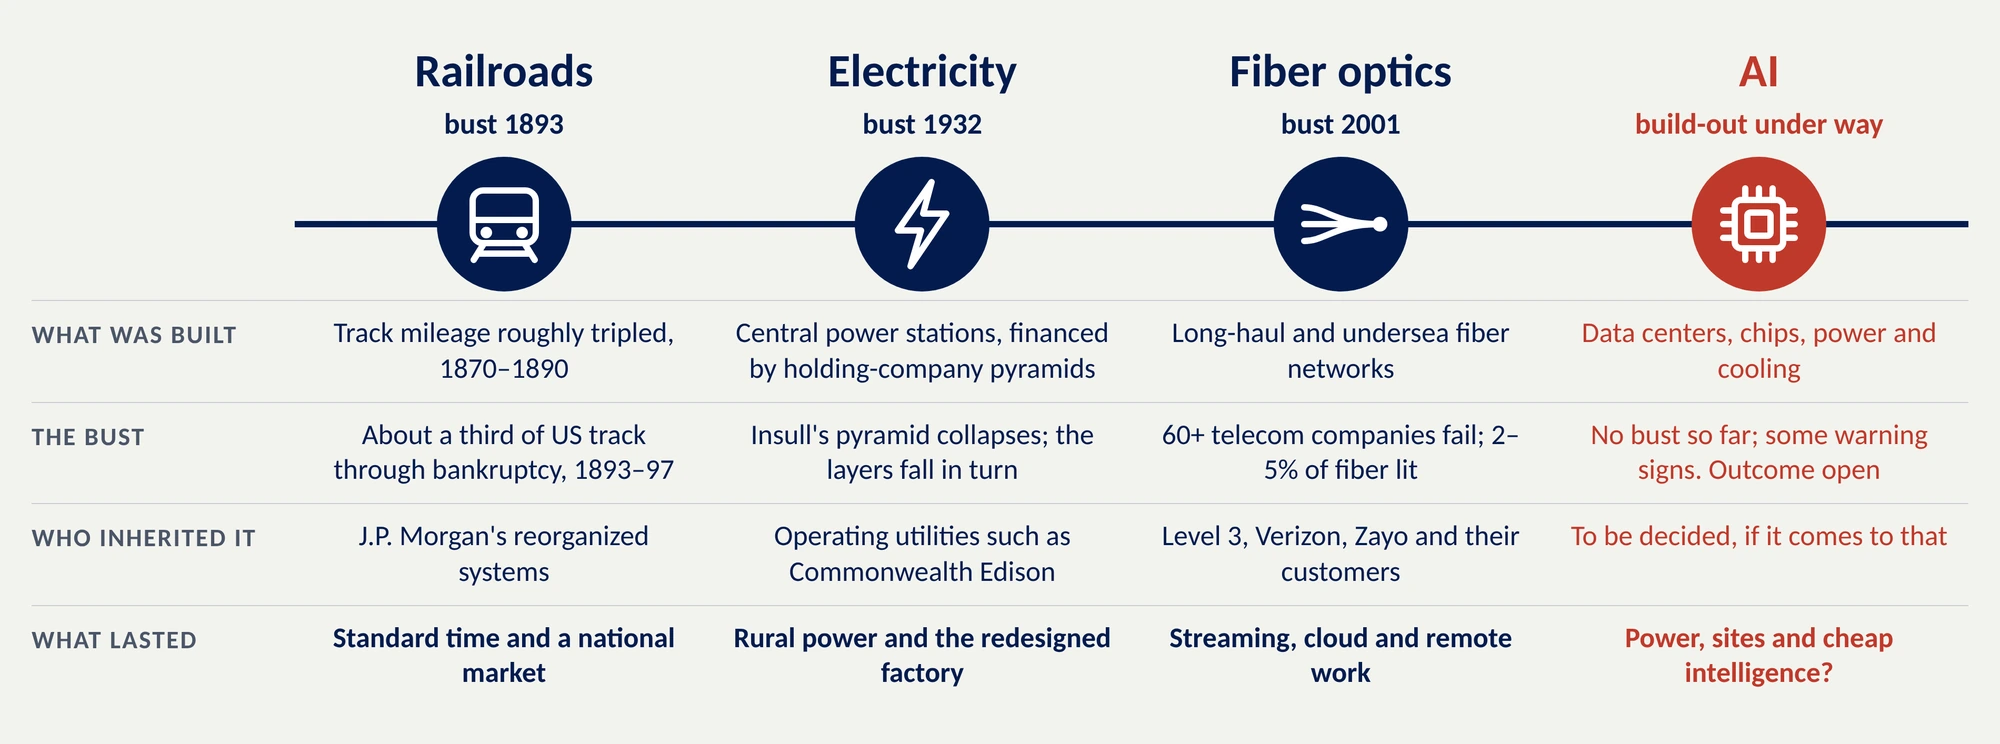
Figure 2. Three booms, three busts, and an open question. Each time, the builders struggled, new owners inherited the network, and the economy kept what was built.
After the Civil War, the United States built railroads at a pace no country had attempted. Track mileage roughly tripled between 1870 and 1890. Much of it was duplicated: rival companies laid parallel lines between the same cities, each betting it would win the traffic. Railroads were too expensive to build out of profits, so they borrowed, mostly by selling bonds that paid a fixed rate of interest whether or not the trains ran full.
That arrangement works in good years and fails all at once in bad ones. In the Panic of 1893, a banking and credit crisis, the bills came due. 119 railroads went into receivership, a court-supervised form of bankruptcy, that year alone, including some of the most famous names in the country: the Union Pacific, the Northern Pacific and the Santa Fe. By 1897, companies owning roughly a third of America's track had passed through bankruptcy. New construction fell from about 4,700 miles in 1892 to 1,800 in 1895 and did not recover until after 1900.
The trains, however, kept running. The track did not disappear when the companies that built it failed. It changed hands. The most famous of the new owners was the New York banker J.P. Morgan, who bought bankrupt lines, wiped out the old shareholders, cut the debt, installed new management, and merged competitors into larger systems. In 1894 he assembled the Southern Railway out of more than a dozen bankrupt lines. The investors who had paid to build those railroads lost heavily. The network they built carried the country into the twentieth century.
What did the country get? Start with time itself. Until 1883, North America ran on more than 140 local times. The railroads needed coherent timetables, so on November 18 of that year they jointly switched to four time zones. Congress did not make standard time the law of the land until 1918; the railroads had simply done it. More important, the rails created a national market. A wheat farmer in Kansas could sell in New York, and a manufacturer in Chicago could sell to the whole country. Much of the modern American economy, from national brands to mail-order retail, grew on that foundation.
Around 1900, electricity was a local affair. A factory that wanted power usually generated its own, with a steam engine in the basement. Cities had small lighting companies serving a few neighborhoods. The man who changed that was Samuel Insull, once Thomas Edison's private secretary, who saw that one very large power station, selling electricity to everyone around the clock, could make power far cheaper than thousands of small ones. This led to his company Commonwealth Edison supplying power to all of Chicago by 1907, and soon across most of Illinois and into neighboring states.
To finance that expansion, Insull stacked holding companies on top of one another, each controlling the one below with a minority stake bought partly by debt. By his biographer’s account, about $27 million of equity at the top controlled some $500 million of utilities in 32 states. He was not alone. By one count, three giant holding-company groups at the top of these pyramids came to control more than 80 percent of the nation's power companies. Hundreds of thousands of ordinary Americans bought the shares.
When the Depression hit, the pyramid behaved the way pyramids do. In 1932 Insull's top holding companies collapsed into receivership, and the layers below fell in turn. Insull fled to Europe, was brought back, and was tried three times on fraud and related charges; he was acquitted each time. Congress responded with the Securities Act of 1933 and the Public Utility Holding Company Act of 1935, which broke the pyramids apart.
What did not collapse was the electricity. The financial layers on top failed; the power plants and wires underneath kept working. Revenue across the industry held up through the Depression, because people kept turning on the lights. Commonwealth Edison kept serving Chicago, and still does as part of Exelon.
The lasting gifts of electrification are almost too large to list, but two are worth singling out. The first is reach. Private utilities had seen no profit in stringing wires across sparsely populated farmland, so in 1935 roughly nine in ten rural American homes had no electricity. The federal Rural Electrification Administration, created that year, lent money to farmer-owned cooperatives to build their own lines. Within two decades, nine in ten rural homes had power.
The second gift, a surge in manufacturing productivity, took even longer to arrive, and is the one I find most relevant today. The economist Paul David noticed that electricity took decades to show up in output per worker. As late as 1899, electric motors provided less than five percent of the power in American factories. A typical factory ran one large engine turning a long shaft down the length of the building, with leather belts carrying power to each machine. Buildings were tall and narrow to keep machines close to the shaft. The first owners to adopt electricity simply swapped the engine for a big motor and kept the shafts and belts. Not much changed.
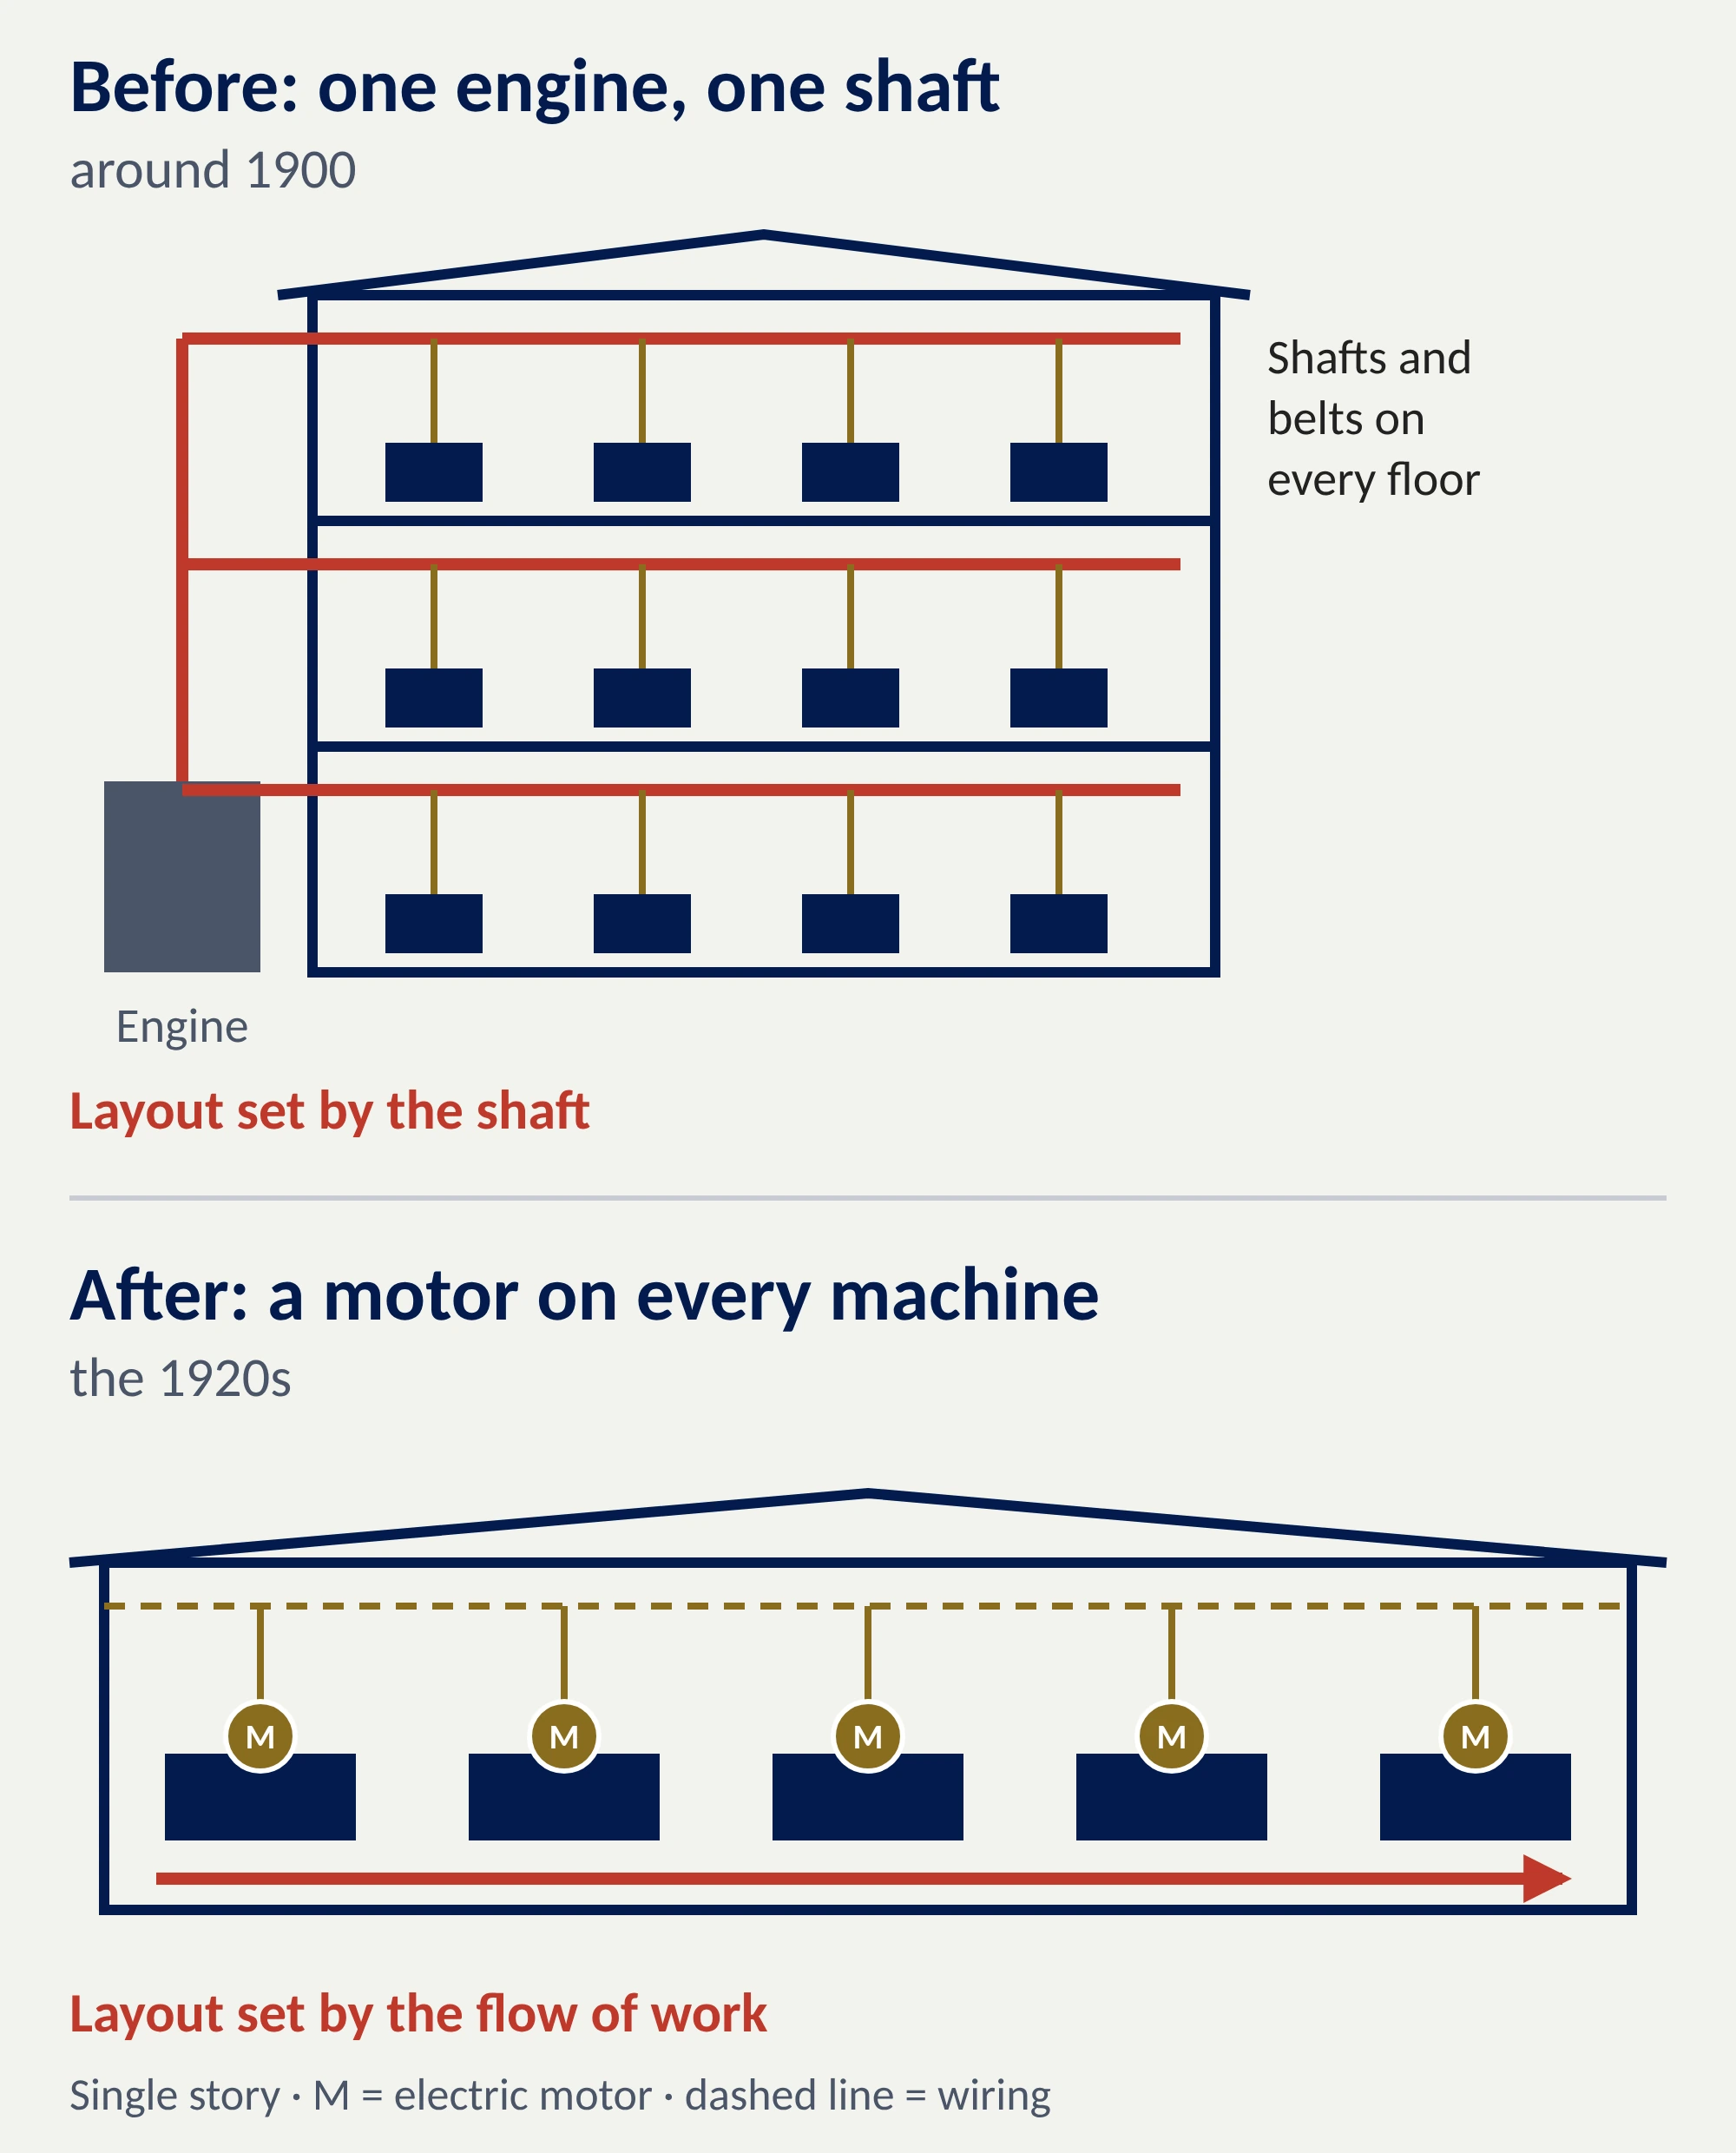
Figure 3. Electricity paid off only when the factory was redesigned around it, with a motor on every machine and the layout set by the work.
The payoff came only when manufacturers redesigned the factory around the new power: a small motor on each machine, single-story buildings, work laid out in the order it flowed. That shift spread in the 1920s, and with it came a surge in productivity, roughly four decades after Edison's first power station.
The floor gets poured first. The value arrives when organizations redesign themselves around the innovation.
Fiber-optic cable carries information as pulses of light through strands of glass thinner than a human hair. A single cable holds many strands, and each strand can carry an enormous amount of data. Fiber that has been installed but is not yet connected to the equipment that sends light through it is called "dark fiber."
In the late 1990s, two forces collided. The Telecommunications Act of 1996 opened phone markets to new competitors, and the commercial internet took off, accompanied by forecasts of traffic growth that turned out to be wildly optimistic. Dozens of new carriers raised money and raced to bury fiber across the continent and under the oceans. Spending on telecom equipment grew about 17 percent a year from 1995 to 2000. Equipment makers such as Lucent and Nortel helped the boom along by lending money to their own customers so they could buy more equipment; Nortel alone had about $4 billion of this "vendor financing" outstanding in 2000.

Figure 4. At the bottom of the bust, the FDIC estimated that only 2 to 5 percent of the fiber in the ground was lit. The rest sat dark until new owners put it to work.
Then the demand did not arrive on schedule. More than sixty telecom companies failed between 2001 and 2003. In 2002, the FDIC estimated that only about 2 to 5 percent of the fiber in the ground was actually lit. WorldCom collapsed in July 2002 amid an accounting fraud, the largest bankruptcy in American history at the time. Global Crossing, which had built an undersea network connecting 27 countries and 200 cities, filed for bankruptcy owing about $12 billion; a majority stake was sold to Asian investors for $250 million. Nortel lost about $27 billion in 2001 and eventually went bankrupt itself.
Once again, the assets outlived their owners, and the new owners did well. Level 3 (now Lumen) bought Global Crossing in 2011 for about $3 billion including debt. Verizon bought WorldCom, by then renamed MCI, for about $6.75 billion.
The bigger winners did not own fiber at all. The glut made bandwidth cheap for a decade, and cheap bandwidth made streaming video, cloud computing, video calls and, in 2020, the overnight shift to remote work possible, all on glass laid by companies that, in many cases, no longer exist.
Which brings us to the present. The AI build-out is the largest infrastructure investment of our time. What is being built is, at its core, a physical thing: data centers filled with specialized chips (mostly graphics processing units, or GPUs, many of them designed by Nvidia), the cooling systems that keep those chips from overheating, and the power plants and transmission lines that feed them. Amazon, Microsoft, Alphabet and Meta alone plan to spend roughly $725 billion on capital investment in 2026, up about 77 percent from 2025. Some analysts expect the total to pass $1 trillion in 2027.
Some of the patterns from earlier booms are clearly visible, and it helps to be precise about who plays which part (Figure 5).

Figure 5. Same parts, new players. The difference this time is who does most of the building, and who is promising to pay for it.
In the telecom boom, equipment makers such as Lucent, Nortel and Cisco sold the switches and routers. Young fiber builders such as Global Crossing and Level 3, along with debt-heavy established carriers such as WorldCom, laid new cable across the country and under the oceans, mostly with borrowed money. Hundreds of start-up carriers, created by the Telecommunications Act of 1996, bought equipment to compete for local phone and data customers, and the equipment makers often lent them the money to do it. Winstar Communications borrowed about $2 billion from Lucent; it went bankrupt in 2001. Much of the building rested on a single forecast: a best-case WorldCom model in which internet traffic doubled every 100 days, repeated across the industry as fact.
The same parts are being played today. Suppliers are again helping fund their customers, now mostly through ownership stakes and long-term purchase commitments rather than loans. Microsoft owns roughly a quarter of OpenAI, and OpenAI has committed to buy an additional $250 billion of computing from Microsoft’s cloud. In October 2026, the International Monetary Fund counted about $1.4 trillion of these commitments and flagged them as a risk worth watching. They are today’s demand forecast, written into contracts, and only as good as the buyers’ ability to pay. There is also a tier of builders working with borrowed money. Oracle plans to raise up to $50 billion this year, about half of it debt, largely to build for OpenAI, and CoreWeave, which rents out AI computing, carried $35 billion of debt by mid-2026. Lenders are getting more cautious: firms like these have had to pay more to borrow in 2026.
The important difference is who does most of the building. In 1999, much of the new fiber was laid by young or heavily indebted companies. Today most of the spending comes from Microsoft, Alphabet, Amazon and Meta, which pay for much of it out of highly profitable businesses. Demand is also already real: millions of people and businesses use AI every day, unlike much of the bandwidth laid in 1999.
So the risk has not disappeared. It has moved, to the borrowed-money builders and to the young AI companies whose commitments justify so much of the construction. Size alone is not protection. Lucent and Nortel were giants too, and when their customers ran out of money, the orders stopped. The question is whether revenue grows fast enough, and at high enough prices, to justify the scale of what is being built.
The difference that worries most is how long the assets last. Fiber laid in 1999 is still in service today; the same glass carries vastly more data because the equipment at either end keeps improving. AI chips are different. Companies generally assume their chips stay useful for five or six years, but some argue that three years is closer to the truth, because each new generation makes the last one less valuable. The rental market is sending its own signal: the hourly price of renting one of Nvidia's top chips has fallen by roughly three-quarters since it launched.
So a more useful question than "is this a bubble?" is: if there is a shakeout, what will outlast it?
I think of it as a ladder.
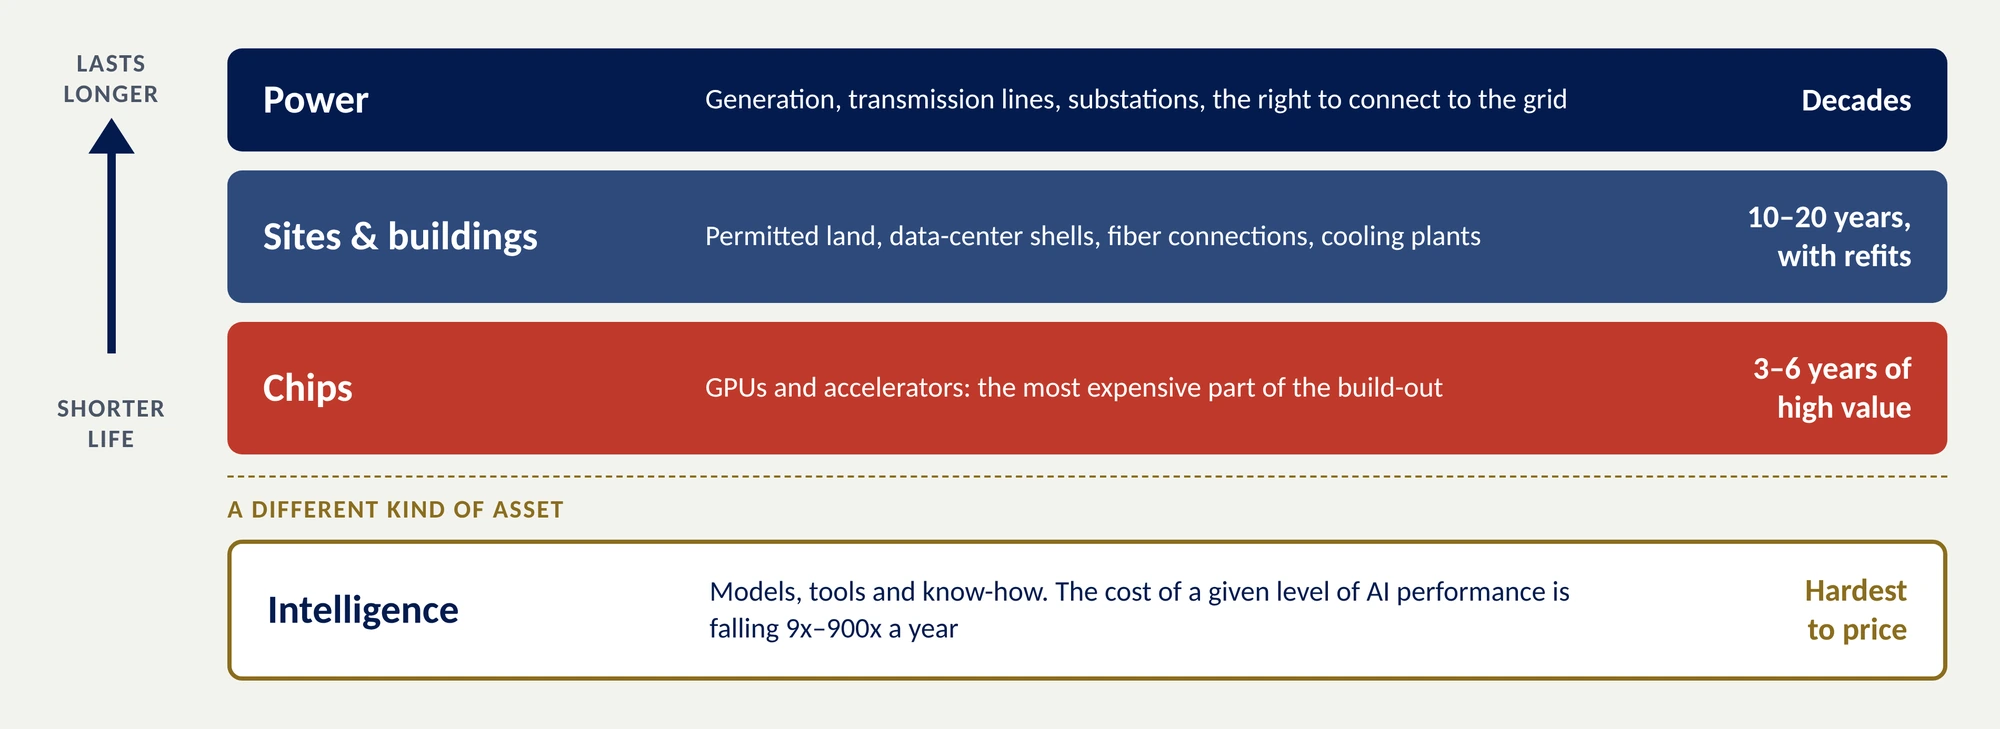
Figure 6. What outlasts the build-out. The most expensive part of it, the chips, is also the least durable.
That last rung is where I think the real lasting gift will be found. The most expensive part of this build-out may be the least durable, while the part that is getting cheaper fastest may be the most valuable.
There is one new risk worth naming. In the earlier busts, the losses fell mainly on investors. This time, some of the risk may fall on ordinary electricity customers. Utilities are planning new power plants and lines to serve data centers whose demand may or may not materialize. If a large customer walks away, someone has to pay for what was built: the utility's shareholders or its other customers. Regulators have started to respond. Roughly three dozen utilities have adopted special tariffs for very large customers, and in Virginia, the country's largest data-center market, new rules for big customers taking effect in 2027 require 14-year contracts and payment for at least 85 percent of the transmission and distribution capacity they reserve, whether they use it or not.
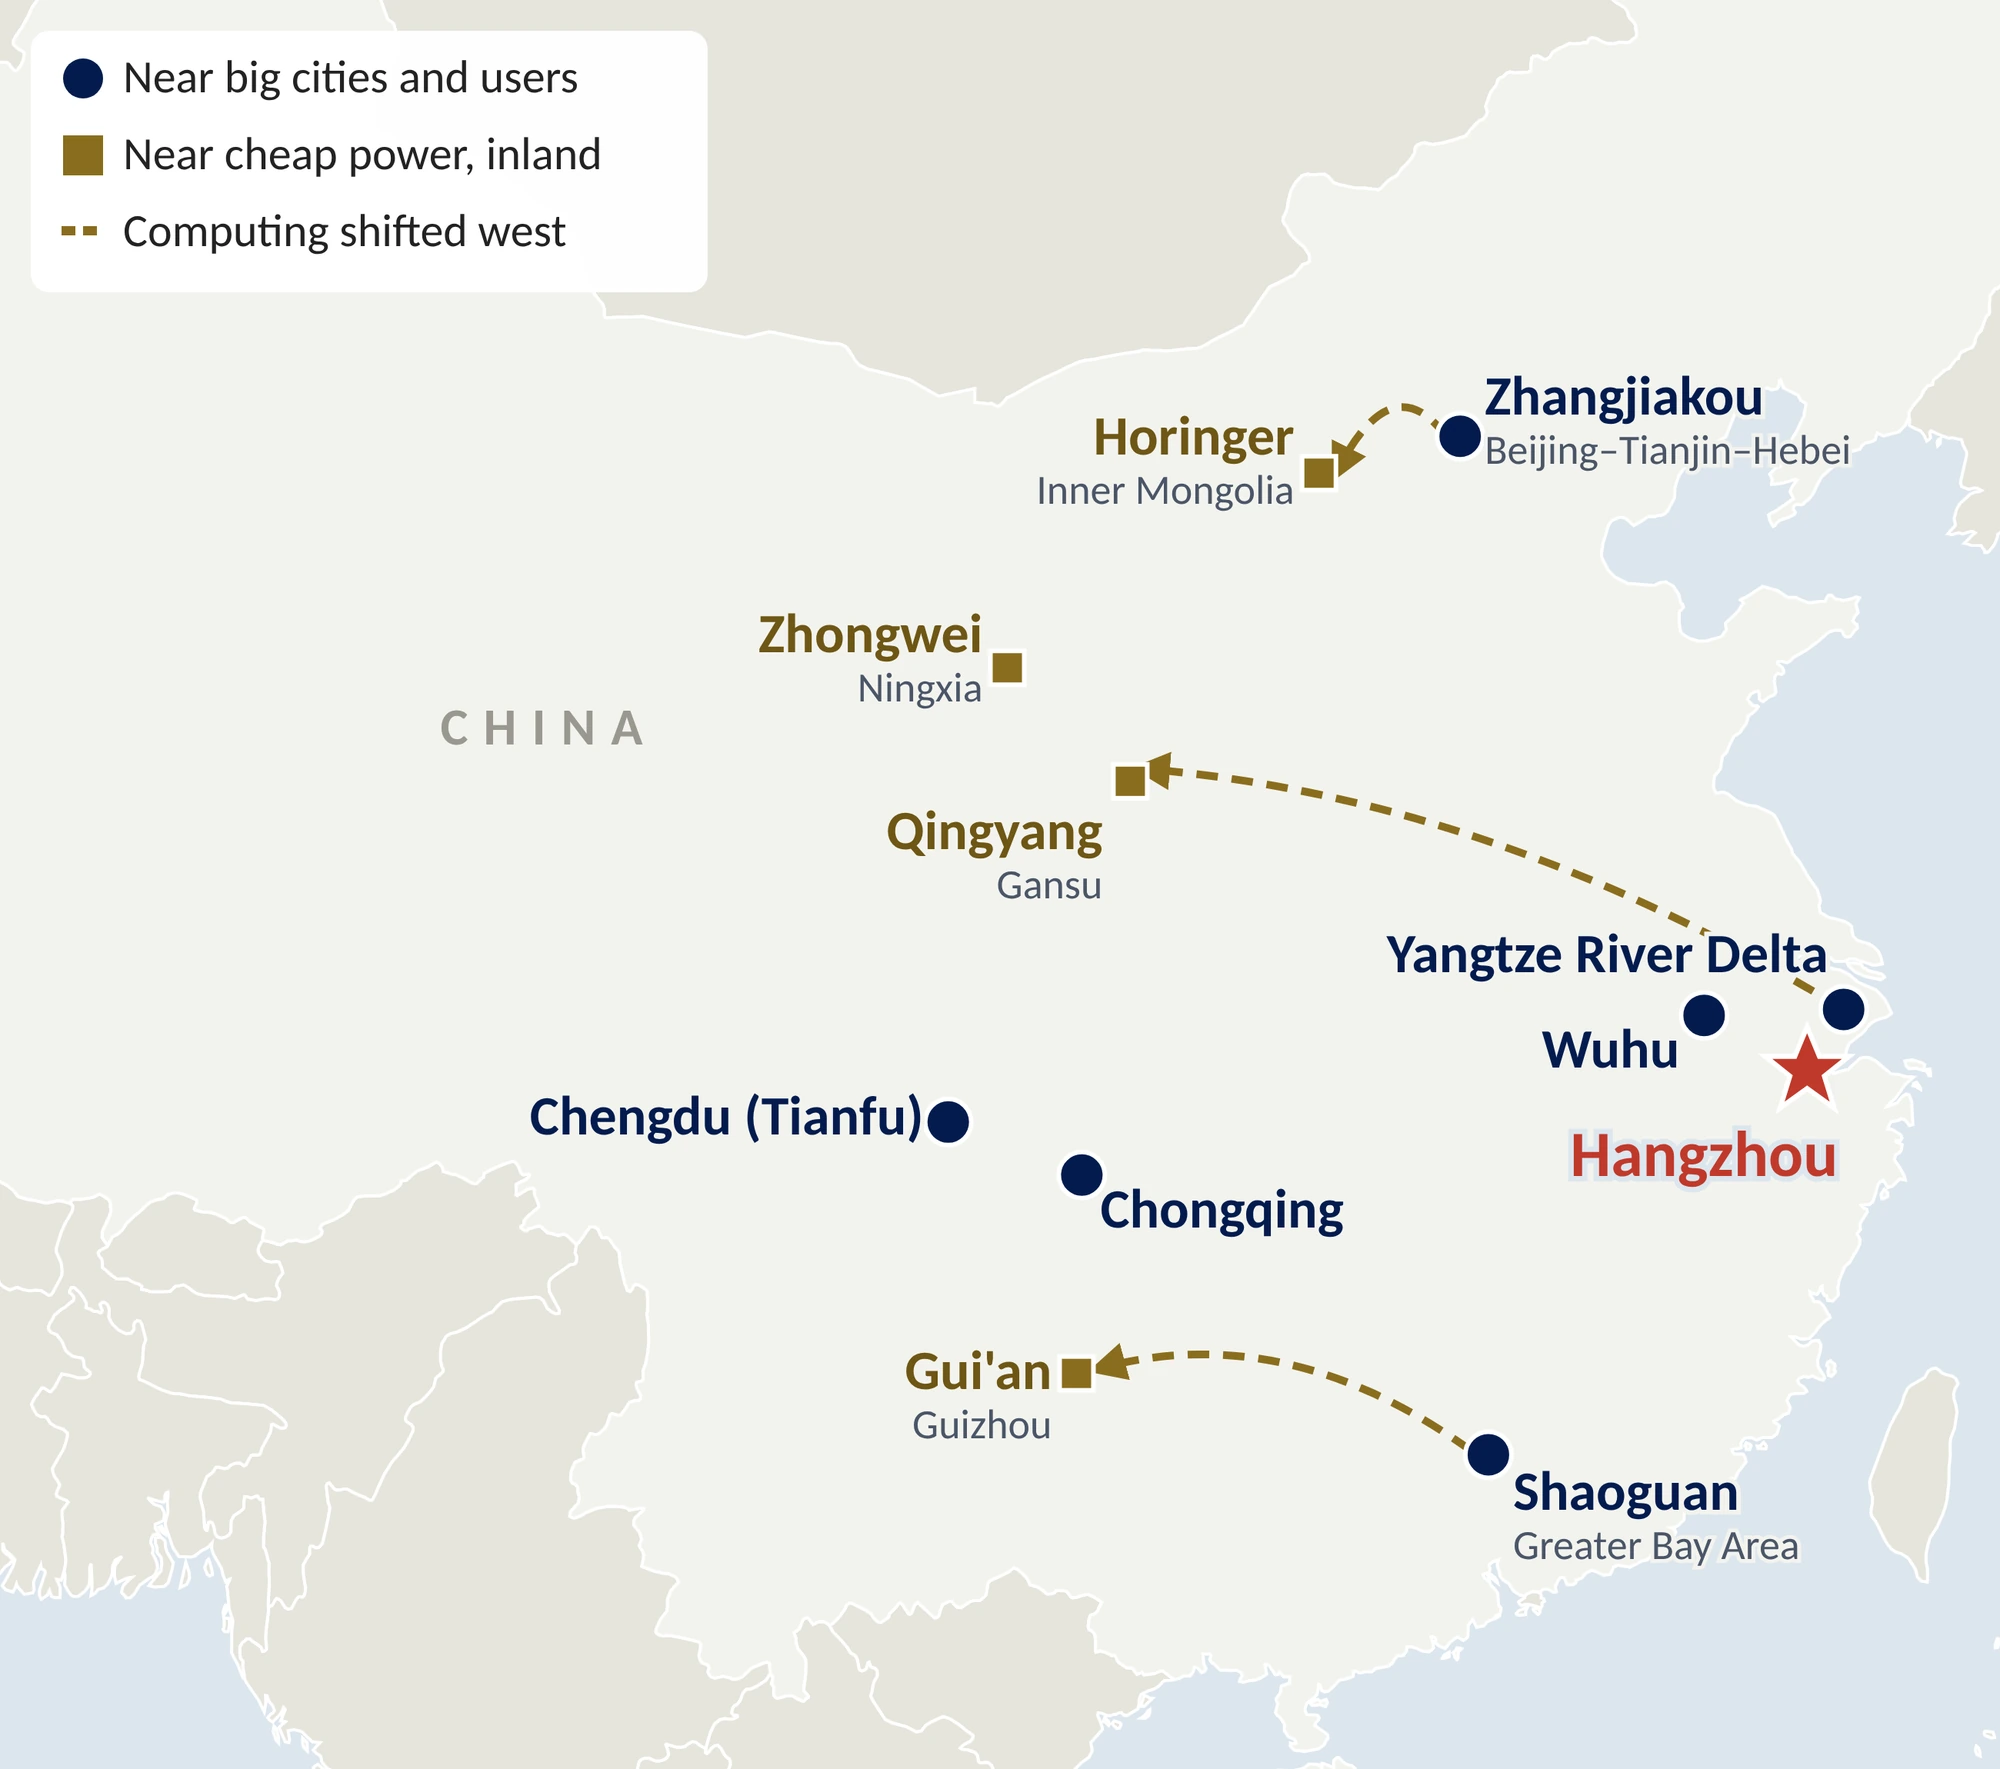
Figure 7. China’s “East Data, West Computing” plan pairs clusters near big cities with clusters near cheap inland power. Locations approximate; base map from Natural Earth.
As with film, China is running the experiment differently. Rather than leaving the build-out to private balance sheets and credit markets, Beijing treats computing power as public infrastructure, much as earlier generations treated electricity and highways. State Grid, the country's dominant utility, plans to invest about $574 billion in its network between 2026 and 2030, 40 percent more than the previous five years. In June 2026, Bloomberg reported a separate plan to spend about $295 billion over five years on a national network of AI data centers, operated by the state telecom carriers China Mobile and China Telecom and funded through ultra-long-term government bonds.
Those figures sit on top of a long habit of building electricity ahead of demand. Power is rarely the thing that holds a project back in China and the numbers bear that out. In 2025, the country added about eight times the generating capacity that the United States added, and its reserve margin, the cushion of generating capacity above peak demand, runs around 80 to 100 percent. That’s about twice the energy generating capacity needed at the busiest moment against only a 15 percent surplus on American grids. Some of China’s capacity is solar and wind, which flatters the comparison, but the direction is clear.
That surplus matters because export controls keep China from the most advanced American chips, so its companies compensate with quantity. Huawei's CloudMatrix system strings together 384 of its own chips to beat Nvidia's flagship system on raw computing power, but it uses roughly four times the electricity. In the United States, that trade would be hard to justify. In China, with cheap and plentiful energy, it is a workable strategy. If the lasting advantage in AI ultimately comes from the models and the intelligence they produce rather than from the efficiency of any particular chip, then cheap, abundant power lets China stay in the race with hardware that is a generation or more behind.
The bigger difference from the American model is who carries the risk. A state-built floor does not need a bust to change hands; the state already owns it. If it is overbuilt, taxpayers rather than bondholders pay. And because plentiful power is not always where it is needed, China is moving the computing to the power: its “East Data, West Computing” plan pairs data-center clusters near its eastern cities with clusters inland, where electricity is cheap (Figure 7). Neither model is proven. The difference is that China’s floor, its power grid, was poured long before AI arrived.
For those of us in automotive and mobility, this pattern is not abstract. We have watched a small version of it play out in electric vehicle charging.
ECOtality ran one of the first large public charging networks in the United States, backed by a federal grant of more than $100 million. It went bankrupt in 2013, and its Blink network of more than 12,000 chargers was sold for $3.3 million. Volta, valued at about $2 billion after going public in 2021, was sold to Shell in 2023 for $169 million. Tritium, an Australian maker of fast chargers that had sold more than 13,000 units in 47 countries and opened a factory in Tennessee, became insolvent in 2024 and was bought by India's Exicom. ChargePoint, one of the largest independent networks, went public in 2021 at a valuation of about $2.4 billion. That did not bring the outcome its backers hoped for: it has lost money every year since it was founded, and after its share price collapsed it combined every 20 shares into one in 2025. Its network of about 385,000 charging ports is still running.
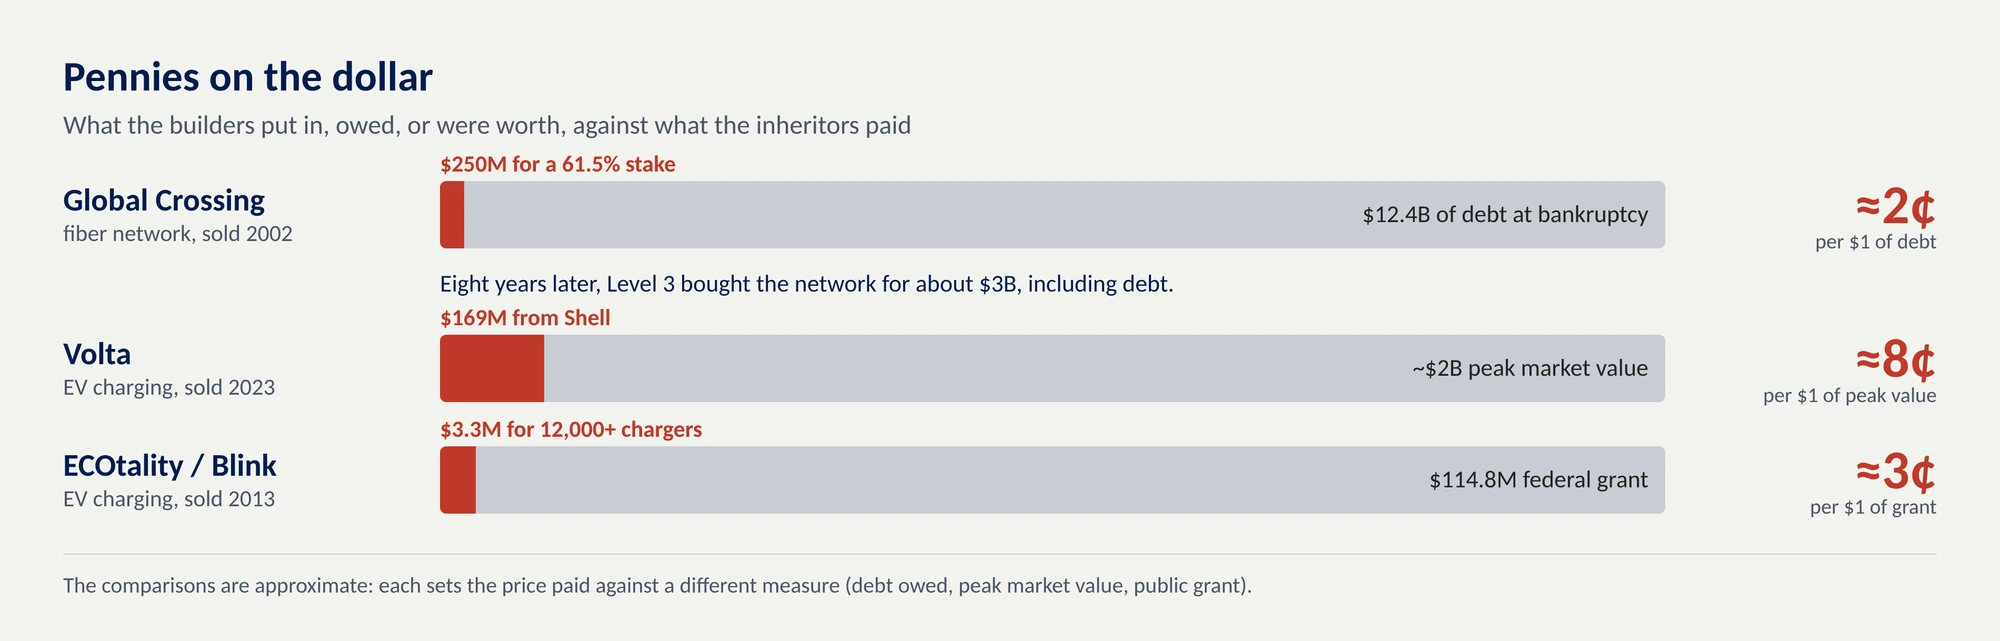
Figure 8. The pattern repeats: a fiber network after the dot-com bust, charging networks today. Inheritors bought for a few cents on the dollar, measured against debt owed, peak value or public money invested.
The United States currently has more than 80,000 public fast-charging ports, many built by automakers themselves. Tesla started its Supercharger network in 2012, at first for its own cars only. Volkswagen's Electrify America, launched in 2017, was the first large automaker-backed network open to every brand, and it is still adding chargers. Eight other automakers have since formed a joint venture called Ionna, which more than doubled its network in 2026. And the industry has largely settled on a single plug, Tesla's. Many of the independent builders struggled; the floor got poured anyway, and the companies whose products depend on it are increasingly the ones pouring it.
The same question now applies to the software-defined vehicle. The computing hardware, connectivity and cloud platforms that modern vehicles depend on are a floor being poured right now, often with partners whose own economics are still unproven. It is worth asking, for every piece of that floor, whether your organization intends to build it, own it, or rent it from whoever ends up inheriting it.

Figure 9. The towpath today, near Lock 15 below Great Falls: part of a 184.5-mile national park that draws millions of visits a year. Photo: Bonnachoven, via Wikimedia Commons (CC0).
In January 1954, the Washington Post published an editorial supporting a plan to pave the old canal into a scenic parkway. The canal, it said, was "no longer either a commercial or scenic asset." Supreme Court Justice William O. Douglas, who walked the towpath regularly, wrote back challenging the editors to walk all 184.5 miles of it with him. They accepted. In March 1954 the party set out from Cumberland, and by the time it reached Washington the newspaper had changed its mind. The parkway plan was dropped in 1956. In 1971 the canal became a national historical park, and in 1977 Congress dedicated it to Douglas.
Today the C&O Canal draws about four and a half million visits a year. Visitors spend more than $100 million a year in the towns along its route, supporting thousands of jobs. And the canal has finally reached Pittsburgh. In 2013, the Great Allegheny Passage, a 150-mile trail laid largely on abandoned railroad beds, including the B&O's, was completed from Cumberland to Pittsburgh. Together with the towpath, it makes a 335-mile route from Georgetown to the Ohio River: the trip the canal's builders set out to make in 1828, finished on the bed of the railroad that beat them. The canal lost the race it was built to win. Its investors lost their money. Its technology was obsolete before it was finished. And yet the path its builders cut along the Potomac became something nobody in 1828 could have planned for, and it is valued more today than it ever was as a shipping route.
That, in the end, is what two centuries of infrastructure booms suggest. The lasting value of an inflection point is rarely the value its builders had in mind. Some of the companies building AI today will not survive the build-out. What they leave behind, the power lines, the sites, and intelligence that gets cheaper every year, will be put to uses none of them are planning for.
It’s not just who builds the floor. It is who learns to stand on it.
As with the first essay, the goal is to leave you with better questions than tidy answers. Here are four:
I Think I’m Extinct
What a hundred years of film can teach the industries technology is remaking right now.
The Real Cost Gap
How Direct Primary Care changes the healthcare affordability equation. A white paper built from a working practice.

If this question is live in your organization — or your career — that’s the conversation.
Get in touch